Published
- 14 min read
Historical Gold Production by State: USGS Rankings (2026)
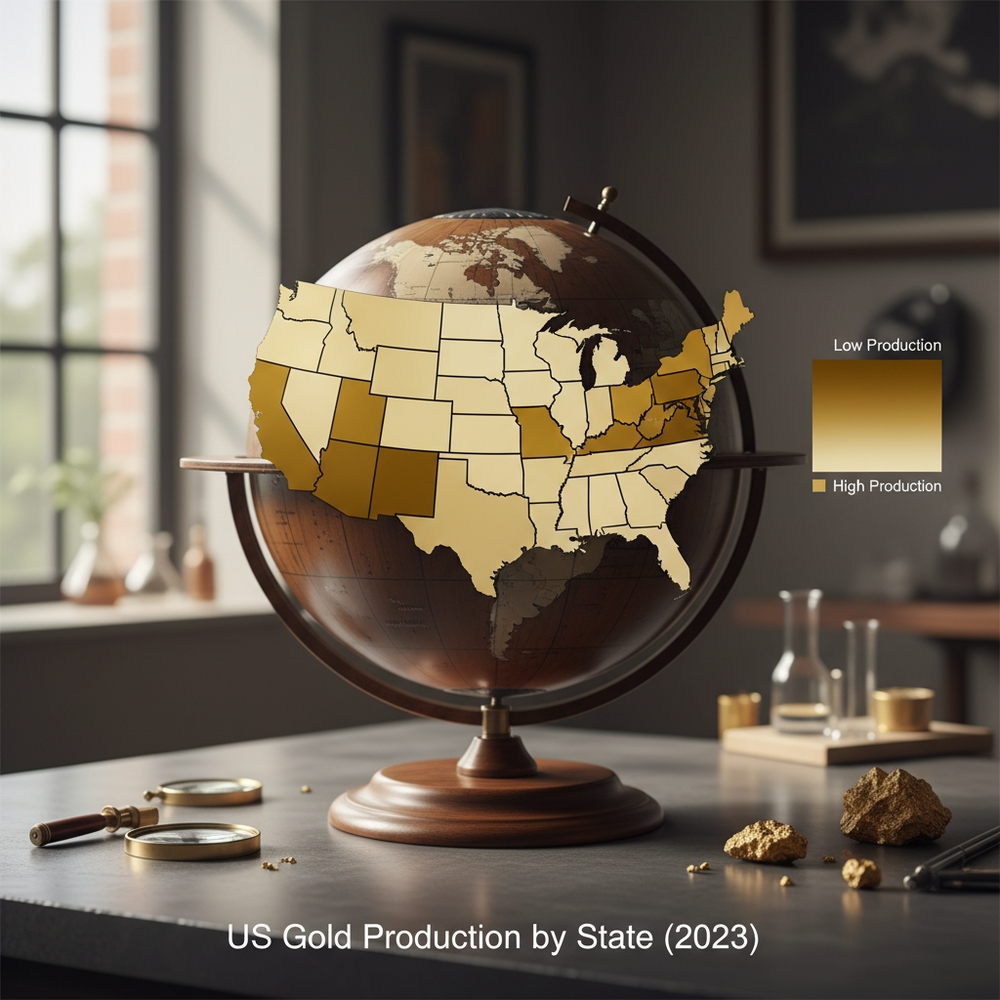
Gold production by state in America tells a sharply lopsided story. Using the USGS Mineral Resources Data System cross-referenced with USGS Minerals Yearbook production figures, the answer is clear: just five states — Nevada, California, Alaska, Colorado, and South Dakota — account for more than 90% of all gold ever mined in the United States, roughly 437 million troy ounces from 1799 through 2025.
I built the GoldFever.app gold mine map by importing every documented gold site in MRDS — 74,805 records across 37 states. But site counts don’t tell the whole story. A state can have thousands of small prospects and produce almost nothing, or a handful of massive operations that dwarf entire countries. This is the production story, ranked.
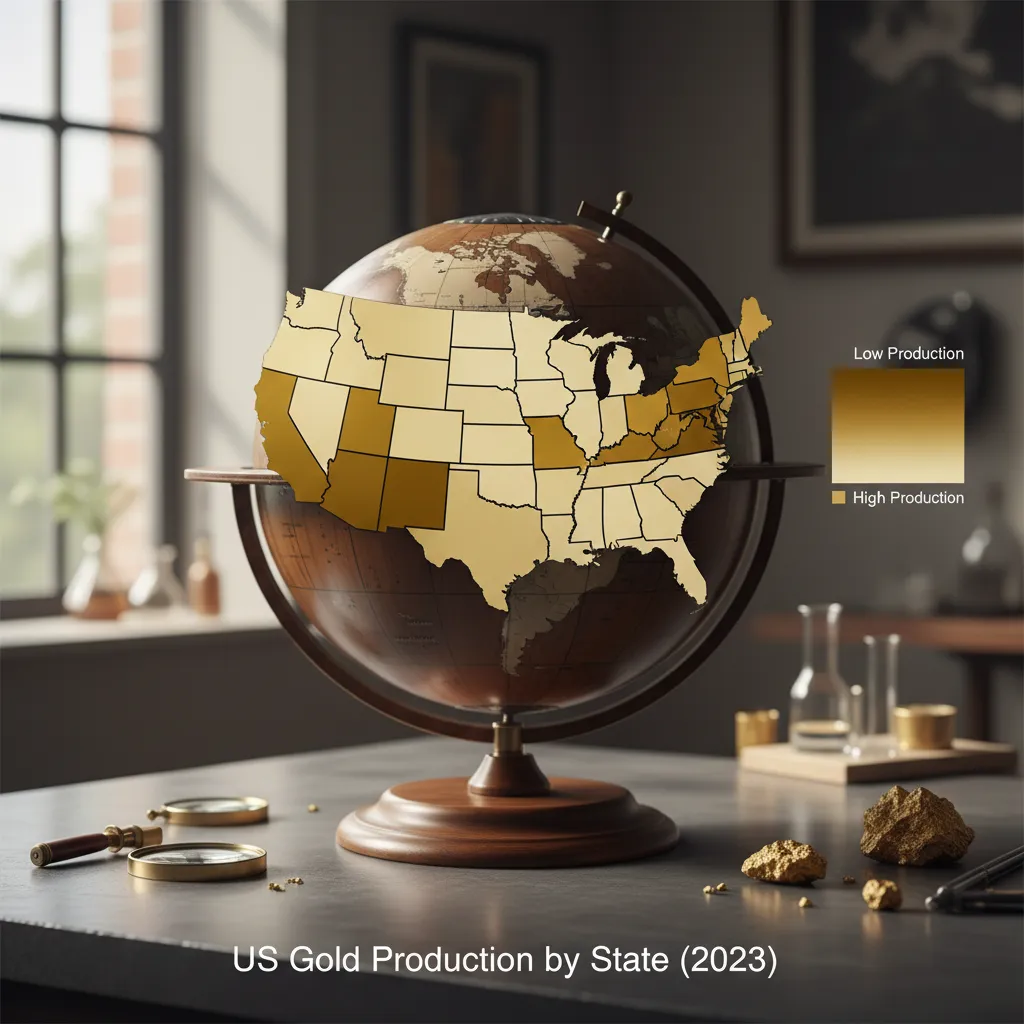
Gold Production by State: Complete USGS Rankings
Production figures below combine USGS Minerals Yearbook annual reports (1900–present), state geological survey historical estimates (pre-1900), and MRDS production attributes. All values are in troy ounces. “Era” splits reflect distinct phases of American mining: the placer-driven Gold Rush era, the industrial deep-rock era, and the modern open-pit cyanide-heap-leach era.
| Rank | State | Total Production (oz) | Pre-1900 | 1900–1950 | 1950–2025 | Active Sites | Past Producers |
|---|---|---|---|---|---|---|---|
| 1 | Nevada | ~225,000,000 | 8,400,000 | 6,200,000 | 210,400,000 | 401 | 3,890 |
| 2 | California | ~118,000,000 | 65,000,000 | 38,000,000 | 15,000,000 | 1,444 | 8,813 |
| 3 | Alaska | ~50,000,000 | 6,500,000 | 20,500,000 | 23,000,000 | 294 | 2,859 |
| 4 | Colorado | ~45,000,000 | 11,000,000 | 26,000,000 | 8,000,000 | 401 | 4,084 |
| 5 | South Dakota | ~44,000,000 | 4,500,000 | 21,500,000 | 18,000,000 | 50 | 364 |
| 6 | Montana | ~18,000,000 | 6,800,000 | 5,400,000 | 5,800,000 | 216 | 2,297 |
| 7 | Arizona | ~16,000,000 | 1,400,000 | 4,600,000 | 10,000,000 | 687 | 2,732 |
| 8 | Utah | ~12,500,000 | 1,200,000 | 4,300,000 | 7,000,000 | 121 | 925 |
| 9 | Idaho | ~8,500,000 | 2,500,000 | 3,200,000 | 2,800,000 | 166 | 1,880 |
| 10 | Washington | ~4,200,000 | 600,000 | 1,800,000 | 1,800,000 | 78 | 685 |
| 11 | Oregon | ~6,000,000 | 2,800,000 | 2,100,000 | 1,100,000 | 333 | 1,572 |
| 12 | New Mexico | ~3,200,000 | 800,000 | 1,400,000 | 1,000,000 | 101 | 638 |
| 13 | North Carolina | ~1,200,000 | 1,100,000 | 80,000 | 20,000 | 65 | 401 |
| 14 | Georgia | ~870,000 | 850,000 | 18,000 | 2,000 | 1 | 297 |
| 15 | Wyoming | ~120,000 | 80,000 | 30,000 | 10,000 | 7 | 116 |
| 16 | Virginia | ~110,000 | 95,000 | 13,000 | 2,000 | 2 | 290 |
| 17 | South Carolina | ~340,000 | 320,000 | 18,000 | 2,000 | 1 | 131 |
| 18 | Alabama | ~78,000 | 72,000 | 5,500 | 500 | 2 | 183 |
| 19 | Tennessee | ~32,000 | 28,000 | 3,500 | 500 | 4 | 42 |
| 20 | Michigan | ~24,000 | 18,000 | 5,500 | 500 | 0 | 35 |
Notes on figures: Production estimates pre-1900 are drawn from state geological survey reports and contemporary mint records; they carry uncertainty ranges of ±10–20% for placer-dominated districts where small operators rarely reported. Post-1900 figures from USGS Minerals Yearbook are considered reliable to within ±2% at the state level. Production rounded to the nearest 100,000 oz for top 10 states, nearest 1,000 oz for lower-ranking states.
The Three Eras of American Gold Production
American gold mining splits cleanly into three eras, each with a different geography, technology, and economic driver. Understanding the era explains why some states like Georgia and North Carolina dominated early production but barely register today — and why Nevada was almost invisible until 1965.
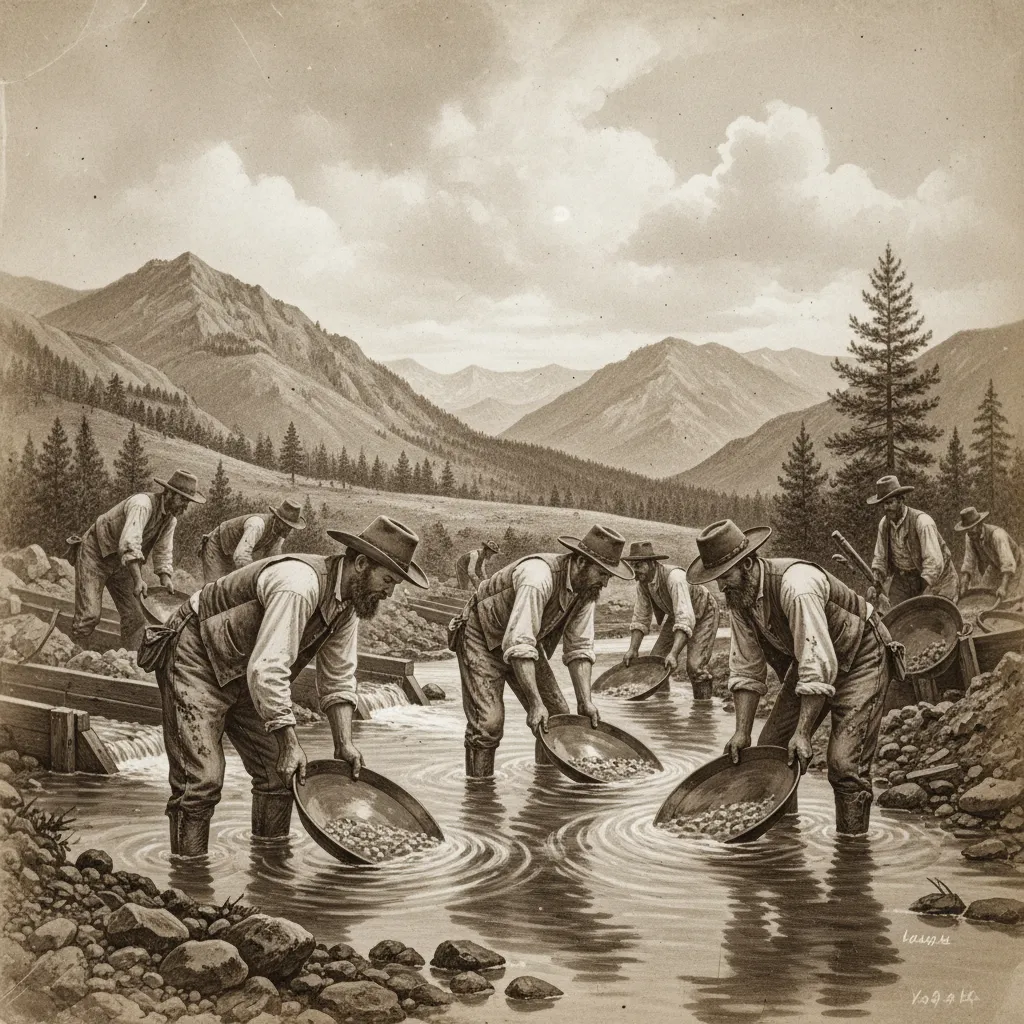
Era 1: Pre-1900 — The Placer Gold Rush Era
The first documented US gold discovery was a 17-pound nugget found by 12-year-old Conrad Reed in Cabarrus County, North Carolina in 1799. For two decades, North Carolina was America’s only gold-producing state, and the US Mint at Charlotte (opened 1838) processed almost all of it. Georgia’s 1828 Dahlonega rush extended the southeastern gold belt and pushed national production to 25,000+ ounces per year.
Then came January 24, 1848: James Marshall’s discovery at Sutter’s Mill triggered the California Gold Rush. Within five years, California gold production hit 3.9 million ounces in 1853 alone — more gold in one year than the entire country had produced in the previous 50.
Pre-1900 production characteristics:
- Method: Hand placer mining (panning, sluicing, rocker boxes), then hydraulic mining (1853–1884)
- Geography: Surface deposits in stream gravels and weathered outcrops
- Top producers: California (65M oz), Colorado (11M oz), Nevada Comstock Lode (8.4M oz), Montana (6.8M oz), Alaska Klondike spillover (6.5M oz)
- Defining technology: Hydraulic monitors, mercury amalgamation, stamp mills
- End of era: Sawyer Decision of 1884 banned hydraulic mining in California; surface placers largely exhausted by 1900
Era 2: 1900–1950 — The Industrial Deep-Rock Era
The placer era ended because the easy gold was gone. Industrial-era miners chased gold-bearing quartz veins thousands of feet underground using shaft mines, drift mining, and stamp mill processing. This is the era of the Homestake Mine in Lead, South Dakota (operated 1876–2002, produced 40+ million ounces — the largest and deepest gold mine in North American history) and Colorado’s Cripple Creek district (peaked 1900 at 850,000 oz/year).
1900–1950 production characteristics:
- Method: Underground shaft mines, cyanide vat leaching (post-1890 MacArthur–Forrest process), dredge mining of older placers
- Geography: Vein deposits at depth; large-scale bucket-line dredges in Alaska and California valleys
- Top producers: California (38M oz from dredging), Colorado (26M oz from Cripple Creek/Leadville), South Dakota (21.5M oz Homestake), Alaska (20.5M oz including Klondike), Nevada (6.2M oz Goldfield/Tonopah)
- Defining technology: Diamond drilling, cyanidation, electric hoists
- Pivotal event: Gold Reserve Act of 1934 fixed gold at $35/oz, sparking a Depression-era mining boom; War Production Board Order L-208 (1942) shut down all non-essential gold mining for World War II
The L-208 shutdown was catastrophic for the industry. Mines that flooded or collapsed during the war never reopened. By the time the order was rescinded in 1945, much of the institutional knowledge and skilled labor had moved elsewhere. American gold production didn’t recover its pre-war peak until the 1980s.
Era 3: 1950–Present — The Open-Pit Cyanide Era
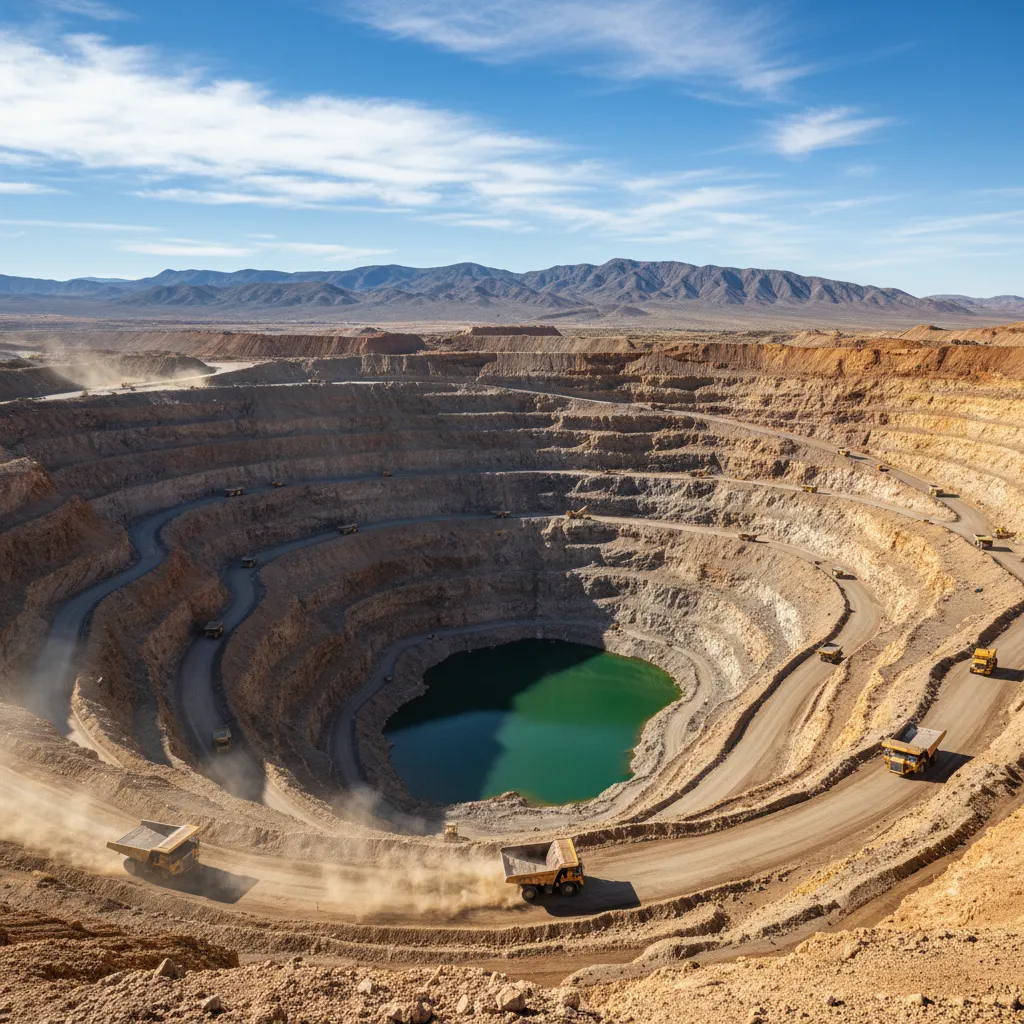
Modern American gold mining is almost entirely a Nevada story, and almost entirely about one geological feature: the Carlin Trend. In 1962, USGS geologist Ralph Roberts predicted that finely disseminated, invisible-to-the-eye “no-see-um” gold would be found in a specific belt of altered sedimentary rocks in north-central Nevada. Newmont Mining drilled the prediction and discovered the Carlin deposit in 1965 — kicking off the modern era.
The Carlin Trend has produced more than 70 million ounces since 1965 and continues at roughly 4 million ounces per year. Nevada’s Cortez Trend (Goldstrike, Pipeline) adds another 60+ million ounces.
1950–Present production characteristics:
- Method: Open-pit mining of low-grade ore (often <0.05 oz/ton), heap leach cyanidation, carbon-in-pulp recovery
- Geography: Sediment-hosted “Carlin-type” disseminated deposits invisible without geochemistry
- Top producers: Nevada (210M oz — 90% of modern US production), Alaska (23M oz including Fort Knox and Pogo), South Dakota (Homestake’s final 18M oz before 2002 closure)
- Defining technology: Bulk earthmoving (haul trucks moving 400+ tons), heap leach pads, fire assay geochemistry
- Current US production: ~5.8 million troy ounces per year (USGS Minerals Yearbook 2024), making the US the 4th largest gold producer globally behind China, Australia, and Russia
Top 10 States by Production: Deep Dives
1. Nevada — 225 Million Ounces
Nevada produces more gold than any other state by a wide margin, accounting for roughly 75% of current US production. The state’s dominance is entirely a post-1965 phenomenon driven by the Carlin Trend, Cortez Trend, and Battle Mountain–Eureka Trend — three parallel belts of disseminated gold deposits in north-central Nevada.
Key districts and production:
- Carlin Trend (Newmont, Barrick): 70M+ oz since 1965, still producing 4M oz/yr
- Cortez/Goldstrike (Barrick): 60M+ oz
- Round Mountain (Kinross): 17M oz
- Comstock Lode (historical, Virginia City): 8.4M oz silver-gold from 1859–1878
The Carlin-type deposit model — gold so fine it’s invisible without electron microscopy, hosted in altered carbonate rocks — was unknown before Nevada. It’s now being applied to exploration in China, Uzbekistan, and Indonesia. Nevada didn’t just produce more gold than any other state; it rewrote the playbook for finding it.
2. California — 118 Million Ounces
California is the historical heavyweight. The Mother Lode belt running 120 miles along the western flank of the Sierra Nevada produced an estimated 45 million ounces from hard-rock mines, plus another 30+ million ounces from placer mining of every river draining the western Sierras. The Klamath Mountains of northern California added another 10–15 million ounces.
Is there still gold in California? Yes — the state still produces small amounts from a handful of operations and supports a thriving recreational prospecting community. But the era of California as a commercial gold giant ended in 1942.
Key districts:
- Mother Lode (Sierra Nevada, Mariposa to El Dorado counties): 45M+ oz
- Sierra placers (Yuba, Feather, American rivers): 30M+ oz
- Klamath Mountains (Trinity, Siskiyou counties): 10M+ oz
- Mojave Desert (Randsburg, Mojave): 2M+ oz
3. Alaska — 50 Million Ounces
Alaska’s production curve is unusual: steady from 1900 through 1942 (Juneau Gold Belt, Klondike spillover, Nome beach placers), nearly zero from 1943–1980, then a sharp rebound from 1990 forward as Fort Knox (Fairbanks, opened 1996) and Pogo Mine (interior Alaska, opened 2006) came online.
Key districts:
- Juneau Gold Belt (Alaska-Juneau, Treadwell mines): 13M+ oz historical
- Fairbanks district (Fort Knox): 8M+ oz modern
- Nome district (beach placers): 4M+ oz
- Klondike spillover (Fortymile, Eagle): 3M+ oz
4. Colorado — 45 Million Ounces
Colorado’s gold history is dominated by Cripple Creek, a single mining district near Pikes Peak that produced 24+ million ounces from 1890 onward — and is still producing today at the Cresson Mine, the only operating gold mine in Colorado. Gold panning in Colorado for recreational miners still happens in dozens of streams in the San Juan Mountains and Front Range.
Key districts:
- Cripple Creek (Teller County): 24M+ oz (still active)
- Leadville (Lake County): 3M+ oz
- San Juan Mountains (Silverton, Telluride): 5M+ oz
- Clear Creek/Gilpin County (Central City): 4M+ oz
5. South Dakota — 44 Million Ounces
South Dakota’s production is essentially one mine: the Homestake Mine in Lead, which operated continuously from 1876 to 2002 — making it the longest-operating and deepest (8,000+ feet) gold mine in American history. Today the Homestake shaft hosts the Sanford Underground Research Facility, including the LUX-ZEPLIN dark matter detector.
6–10: Montana, Arizona, Utah, Idaho, Washington
The remaining top-10 states are characterized by:
- Montana (18M oz): Bannack/Virginia City placers, Butte copper-gold byproduct, modern Golden Sunlight Mine
- Arizona (16M oz): Vulture Mine (1860s), modern byproduct from Morenci/Bagdad copper porphyries
- Utah (12.5M oz): Bingham Canyon (largest gold byproduct producer in US history), Mercur district, Tintic
- Idaho (8.5M oz): Florence/Warren/Boise Basin placers, Yellow Pine, Coeur d’Alene byproduct
- Washington (4.2M oz): Wenatchee district, Republic, modern Buckhorn Mine (closed 2017)
Active vs Abandoned Gold Mines: What’s Still Producing
Of the 74,805 documented gold sites in USGS MRDS, only 4,468 are classified as currently producing — about 6% of total sites. The remaining 94% are abandoned, prospects, or occurrences. Here are the states with the most active gold operations:
| State | Active Producers | Most Significant Active Mines |
|---|---|---|
| California | 1,444 | Mesquite Mine (Equinox Gold), Castle Mountain |
| Arizona | 687 | Copperstone Mine, Moss Mine |
| Nevada | 401 | Carlin Complex, Cortez, Round Mountain, Long Canyon |
| Colorado | 401 | Cripple Creek & Victor (Newmont) |
| Oregon | 333 | Grassy Mountain (development), small placer operations |
| Alaska | 294 | Fort Knox (Kinross), Pogo (Northern Star), Kensington |
| Montana | 216 | Golden Sunlight (closed 2019), various small operations |
| Idaho | 166 | Stibnite Gold Project (development), Beartrack |
| Utah | 121 | Bingham Canyon (byproduct), various small operations |
| New Mexico | 101 | Several copper-gold byproduct operations |
Reality check: California’s “1,444 active producers” includes thousands of recreational and small commercial placer claims producing under 100 ounces per year combined. Nevada’s “401 active producers” includes a handful of operations each producing 200,000+ ounces annually. Site counts don’t reflect production scale.
How This Data Was Compiled
Every figure above is sourced from public USGS and state geological survey records. Here’s the methodology:
Site counts: Direct query of USGS MRDS filtered for gold-bearing commodities (Au primary or significant byproduct), grouped by state and operation status. Imported into the GoldFever.app gold mine map for verification and visualization.
Pre-1900 production: Compiled from individual state geological survey publications. Key sources: California Division of Mines Bulletin 193 (Clark, 1970); Colorado Geological Survey Bulletin 138 (Henderson, 1926); USGS Professional Paper 610 (Koschmann & Bergendahl, 1968 — “Principal Gold-Producing Districts of the United States”).
1900–2025 production: USGS Minerals Yearbook annual “Gold” chapter, available continuously from 1932 to present at the USGS National Minerals Information Center. State-level production data became confidential after 2000 for districts with fewer than three producers, so post-2000 figures involve estimation from company SEC filings and NI 43-101 technical reports.
Uncertainty ranges: ±10–20% for pre-1900 placer figures (poor reporting), ±5% for pre-1900 lode figures, ±2% for 1900–2000 figures, ±5% for post-2000 figures where data is partially aggregated.
Frequently Asked Questions
Which state has produced the most gold in US history?
Nevada has produced approximately 225 million troy ounces of gold from 1859 through 2025, making it the all-time leader. Nevada surpassed California’s cumulative total around 1990 due to the Carlin Trend boom. California led from 1850 through the 1980s.
Which state currently produces the most gold?
Nevada produces approximately 4.5 million troy ounces of gold per year as of 2024 — roughly 75% of all US gold production. Alaska is a distant second at ~700,000 oz/year.
How much gold has the US produced in total?
The United States has produced approximately 480 million troy ounces of gold from 1799 through 2025, according to cumulative USGS Minerals Yearbook data. At $2,300/oz that represents over $1.1 trillion in 2026 dollars.
Are there still active gold mines in every state?
No. Of 50 states, only 12 currently have commercial gold production: Nevada, Alaska, Colorado, Arizona, California, Utah, Idaho, Montana, Washington, South Dakota, New Mexico, and small-scale operations in Oregon. The historic eastern gold belt (Georgia, North Carolina, South Carolina, Virginia, Alabama) has essentially zero commercial production today, though recreational prospecting is permitted in many areas.
Why does Nevada produce so much more gold than other states today?
Nevada hosts the Carlin Trend, Cortez Trend, and Battle Mountain–Eureka Trend — three parallel belts of sediment-hosted “Carlin-type” gold deposits where gold occurs as microscopic particles invisible to the eye but recoverable in bulk through heap-leach cyanidation. This deposit type wasn’t recognized until 1962 and remains unique in North America at this scale.
How does US gold production compare globally?
The US ranks 4th globally in annual gold production at ~5.8 million ounces (2024). China produces ~12 million oz, Australia ~10 million oz, and Russia ~9 million oz. South Africa, historically the world’s largest producer, has fallen to ~3 million oz.
Where can I see all these mines on a map?
Explore every documented gold mine in the USGS database on the GoldFever.app gold mine map — searchable by state, filterable by status, with 74,805 individual sites plotted.
Actionable Takeaways for Modern Prospectors
If you’re a recreational prospector trying to use this data, here’s how to read it:
-
High production state ≠ best place to pan. Nevada produces the most gold today, but virtually all of it is locked inside industrial open-pit operations on private claims. You can’t legally pan the Carlin Trend.
-
Pre-1900 placer districts are where recreational gold lives. The states where 90%+ of production happened before 1900 — California, Colorado, Montana, Oregon, Idaho, Alaska, Georgia, North Carolina — are where surface placer gold still exists in detectable amounts in publicly accessible streams.
-
High past producer count + low active count = recreation opportunity. California (8,813 past producers, 1,444 still small-scale active) and Oregon (1,572 past producers, 333 small-scale active) are the recreational prospector’s sweet spot.
-
Use the map to find your spot. Pick a state, filter to “past producer” sites in MRDS, cross-reference with public lands access maps, and you have a research-driven prospecting target list rather than a guess.
-
State production rank predicts community size. Top-10 states have active prospecting clubs, GPAA chapters, and active claim trading. Pick a state with infrastructure if you’re starting out — California, Colorado, and Arizona have the strongest beginner ecosystems.
Sources and Further Reading
- USGS Mineral Resources Data System (MRDS): mrdata.usgs.gov/mrds — 74,805 gold-bearing site records
- USGS Minerals Yearbook: Gold: usgs.gov/centers/national-minerals-information-center/gold-statistics-and-information — Annual production statistics since 1932
- USGS Professional Paper 610: Koschmann & Bergendahl (1968), “Principal Gold-Producing Districts of the United States” — Foundational reference for pre-1965 district production
- Nevada Bureau of Mines and Geology: nbmg.unr.edu — Carlin Trend geology and production history
- California Division of Mines and Geology Bulletin 193: Clark (1970), “Gold Districts of California”
- Sanford Underground Research Facility: sanfordlab.org — Homestake Mine history
Data compiled by GoldFever.app from public USGS and state geological survey records. Production figures rounded; see methodology notes in body for uncertainty ranges. Last verified: May 2026.